Showing posts with label Styles. Show all posts

Monday, December 3, 2018

Convert Survey Figures to Polylines

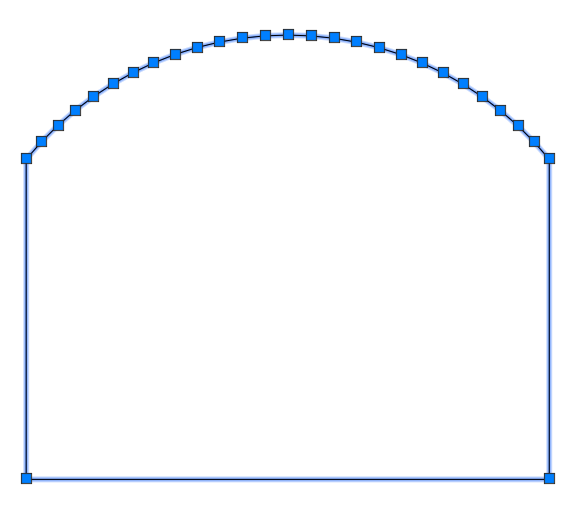
Sometimes survey figures are exactly what you want and other times you just want a polyline at elevation zero. If your like me, you created a figure style that flattens all elevations to zero then you exploded it. If that figure had an arcs, they became segmented like this:
I'm happy to report that there is a workflow to create these polylines with arcs from figures. I have confirmed that this workflow will work for versions 2016 through 2019. Note that the polylines will not update if the survey figure changes and is updated in the drawing.

Create a 2D figure style in your template

  1. In your template, expand the Toolspace > Settings tab > Survey > Figures category.
  2. Right click on Figure Styles and choose New.


  3. In the Figure Style dialog > Information tab, set the figure style name to 2D.


  4. In the Figure Style dialog > 3D Geometry tab, set the Figure display mode to Flatten figure to elevation and confirm that the Flatten figure to elevation is set to 0.00.


  5. In the Figure Style dialog > Display tab, change the layer, color, linetype, and so on to meet your CAD standards then click OK.
  6. Right click on the Toolspace > Settings tab > Survey category and choose Edit Feature Settings.


  7. In the Edit Feature Settings - Survey dialog, expand the Default Styles category and set the Default Figure Style to the 2D figure style you just created then click OK.


  8. Save and close the template.

Export Survey Figures to Polylines at Elevation Zero

  1. Begin a drawing with the template that contains the 2D figure style.
  2. Open a survey database and import figures to the drawing. The default style should be the 2D figure style.
  3. Set the UCS to World then save the drawing.
  4. In the application menu, select Export > Export Civil 3D Drawing.


      NOTE: Exploding figures using the 2D figure style will create polylines with segmented curves. That's why you'll need to use the Export Civil 3D Drawing command to get polylines with arcs.

  5. In the Export Autodesk Civil 3D Drawing dialog, choose the folder for the exported drawing then click Export.


  6. When the export is complete, click OK in the Export Status Dialog then Cancel in the Autodesk Civil 3D Drawing dialog.


  7. Open the exported drawing and confirm that the figures were exported to polylines at elevation zero.
  8. Select all the polylines representing exported figures and copy to the clipboard with a basepoint using SHIFT+CTRL+C and entering 0,0 as the base point.
  9. If you are replacing the figures in the original drawing, you can now delete them.
  10. In the original drawing, confirm that the UCS is set to World then use CTRL+V and enter 0,0 as the insertion point to paste the polylines into the correct location.
  11. Save the drawing.
An alternate workflow might be to have a separate template for importing just figures into a temp drawing so that you can export them and they will be on the correct layer. For this you'll need separate figure styles for each type of figure/layer combination you need. Then you can choose to import figures into the original base drawing onto the feature line or equivalent layer and have them displayed as a 3d object instead of a 2D object.

Wednesday, February 18, 2015

Where Do You Think You're Going?

I saw an interesting issue today with a General Line Label. Here's how it looked in the source drawing. A user imported a general line label style and added the label to an existing AutoCAD object in the new drawing. The problem was that the arrowheads were pointing in the wrong direction. It looked similar to this label.

A General Line Label with arrowheads at each end of the segment with the incorrect rotation angle.

I compared the style settings between the source and destination drawing. Everything matched exactly. The only difference between the original label and the new label is that the original label was on a polyline and the new label was on a line that had an elevation of 500 for one endpoint and an elevation of 0 for the other endpoint. Once I set one endpoint elevation to match the other endpoint (both at elevation 0), the label then looked exactly as it was designed to look.

A General Line Label with arrowheads at each end of the segment with the correct rotation angle.

Lesson of the day #1: Sometimes polylines are a better choice than a line for labeling.

Lesson of the day #2: OSNAPZ to the Rescue.

Tuesday, December 11, 2012

Slow Down and Render This

Yesterday, I received an email with an attached drawing. Verbally, the request was to determine why the drawing is so slow, especially when using the zoom extents.The email included the following additional information:

This file was messing up badly on Wednesday...crazy slow, etc.

This morning with my new reload of AutoCAD 2011, it wasn't as bad... but still has signs of corruption...


One thing that I noticed is that the TIN in the V-TINN-VIEW layer doesn't look right... the contours are fine... but I didn't know if you had a fix for that...


There are lots of things that can cause a drawing to be a little slow. I have a list of things I check in a drawing but I knew that many of those had already been checked by the owner of this drawing. The comment about the TIN not looking correct was definitely a clue to the problem as was the knowledge that the user had recently been working with point clouds including some third party software.

I knew the fresh install and absence of the third party software had ruled out that being the issue so my first option was simply to open the drawing. Here's what I saw in the bottom left corner of the application:

This is not the ucs icon that I typically see in my drawings. The thickness of the ucs icon elements was an indication to me that the visual style was set to something other than 2D Wireframe.

To verify my suspicion, on the View ribbon tab, I selected the dropdown on the Views Panel and found the visual style was set to Hidden.


 I left clicked on the Hidden visual style and changed the visual style to 2D Wireframe.


Now the ucs icon looks as expected and the speed of the drawing has returned to "normal".


Now if you are using AutoCAD 2012 or later, take a look at the upper left corner of model space. There you should find the Visual Style Controls.


As you can see, the visual style in this drawing is now set to 2D Wireframe. Changing this setting from Hidden to 2D Wireframe greatly improved the speed of the drawing.

Tuesday, December 13, 2011

Quick Tip about Importing Styles and Settings


If you're using Civil 3D 2012, you've hopefully already heard about the ability to Import Styles and Settings. This new command is a real time saver but be careful, because you may not be getting everything you want.

Here are a few things you won't get by using the Import Styles Command:

  • Object Layer Settings (Use this workaround to transfer the settings to your current drawing)
  • Blocks and Layers not used in styles (Use Design Center to import all layers and blocks)
  • Description Key (Use old style drag & drop to import into your current drawing)
  • Parts Lists (Use old style drag & drop to import into your current drawing)
There may be more items that aren't imported, but those three items will definitely be missing if you use the Import Styles command.

Feel free to add comments for additional items that you find missing when you use the command.

Added Parts Lists per TimStalin's comment.

Wednesday, September 14, 2011

Get Those Child Styles Under Control

Have you ever created a child style, changed a setting on it, then wished that component property was still following the default setting from the parent style? This is especially apparent when changes are made to the Text Contents of a component. Before you go blaming the software for not working correctly, take a look at the style itself. It may be doing exactly what you told it to do.

Once you make a change to any part of a component of a style, an override is flagged on the Summary tab and that part of the component will no longer follow the changes made to the parent style. Here's a short exercise to show how it works:
  1. Create a new drawing from the "_AutoCAD Civil 3D (Imperial) NCS template" in Civil 3D 2012.
  2. In the Toolspace, Settings tab, locate the Structure Label Styles.


  3. Expand the Label Styles and select the label style named "Data with Connected Pipes (Sanitary)", right click, and choose Edit... from the list.


  4. After the Label Style Composer dialog box is open, select the Layout tab and verify that there are three components in this style: Structure Text, Incoming Pipes, and Outgoing Pipes.


  5. Now close this dialog box by left clicking on Cancel.
  6. Locate the Structure Label Style in the Toolspace Settings tab again. This time right click on the "Data with Connected Pipes (Sanitary)" style and choose "New..." from the list.


    This will create a child style of the selected label style.
  7. In the Label Style Composer dialog box, select the Information tab and edit the Name to: "Data with Connected Pipes (Sanitary) [Description Only]". You can also edit the Description for this label style on the Information tab at this time.
  8. Now select the Layout tab, then in the Component name: dropdown list, select "Incoming Pipes".


  9. Under the "General" section, locate the "Visibility" property . Change the value to False.


  10. Repeat this process for the Outgoing Pipes component too.
  11. Now select the Summary tab. In the Property column, left click on the by Component 2 to expand the properties of that component. 
In the Override column there should be a green check mark in the box in the General: Visiblity row. This means that even if you change this visibility state in the parent style, such as setting the value to False, the visibility state of this component will not change. There should be a green check mark in the box in the General: Visibility row of Component 3 as well. Left click on OK to complete these changes to the style.

Now to see how this change affects the parent style, edit the original label style. You can do this by repeating Step 3, then selecting the Summary tab. Left click on the by Component 2 and you'll see a gray arrow pointing down in the Child Override column. This indicates that this property has been overridden in at least one child style. If you want to remove this override from all the child styles, left click on the gray arrow. A small red x will appear near the bottom right side of the gray arrow to indicate that you will be removing these overrides. Left click on Apply. The Summary tab will refresh at this point and all expanded properties will collapse. Left click on the by Component 2 again and there should no longer be a gray arrow in the Child Override column of the General: Visibility row. You can edit the child style to verify that the Visibility of Component 2 was reset to True.

The point of this exercise was to show you how and when the overrides are created so that if your child style isn't responding the way you expect when a change is made to the parent style, take a look at the Summary tab and look for Overrides.

Tuesday, September 13, 2011

Multiple Surface Dilemma (Part 3)

NOTE: This is Part 3 of the Multiple Surfaces Dilemma Series. You can view Part 1 of the series here. In Part 1 of this series, a surface named ComboSurface was created. Make sure you create that surface in your drawing before proceeding with these steps.

Wouldn't it be nice to have a visual representation of the target minimum depth in the profile view while you're designing your pipe network? Here's a way to make that happen:

Create a new surface in your current drawing and name it "MinimumDepth". You can use the same procedure as described for creating the "ComboSurface" in the original post of this series. Just as with the ComboSurface, this surface will not need to be displayed so set the surface style to "_No Display" as it's created.

To add some substance to the new surface, you'll need to paste the ComboSurface into the MinimumDepth surface. Again, use the same procedure described in the original post of this series except you'll be pasting a different surface.

Under the MinimumDepth surface definition, locate the Edits option, right click, and select "Raise/Lower Surface".
 

When prompted at the command line, enter -4 to lower the MinimumDepth surface 4 feet.

The last thing to do is create a profile based on the MinimumDepth surface:
  1. On the home ribbon tab, locate the "Create Design" Panel, left click on Profiles, then choose "Create Surface Profile" from the drop down list.


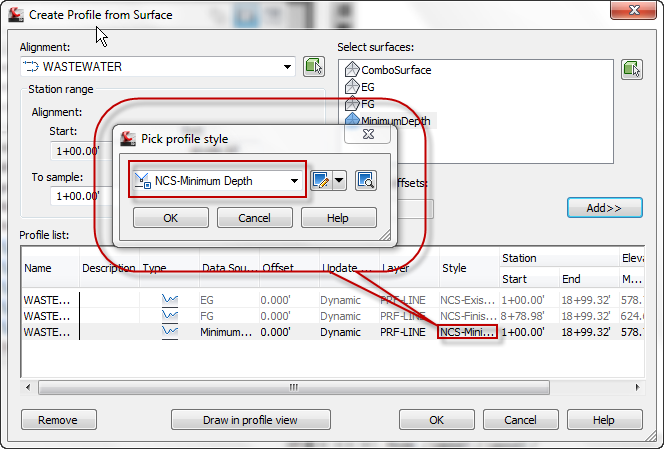
  2. In the Create Profile from Surface dialog box, select the alignment, select the MinimumDepth surface, then left click on Add.


  3. Change the style of the newly created profile to a style called "Minimum Depth". This style places the profile linework on a layer that doesn't plot and has a forced color and linestyle to look different from all other profiles.


The final product looks like this:


Monday, September 12, 2011

Multiple Surface Dilemma (Part 2)

NOTE: This is Part 2 of the Multiple Surfaces Dilemma Series. You can view Part 1 of the series here. In Part 1 of this series, a surface named ComboSurface was created. Make sure you create that surface in your drawing before proceeding with these steps.

In this post, I'm going to assign the ComboSurface to the Pipe Network in the network properties dialog box.
  1. Since the pipe network has already been created in my drawing, I just need to locate it in the Prospector tab of Toolspace, select it, right click, and choose Network Properties.


  2. Set the surface name to ComboSurface.


Now as I place pipes and structures in this pipe network, the correct elevation will be used/reported (EG or FG) according to the location of the pipe or structure. Remember, you don't want this surface visible, just create it and select it from the list of surfaces when needed.

Thursday, May 5, 2011

Water Structures in Profile View

You know that special symbol for water valves and fire hydrants that the engineers want to see in profile views of water lines? Ours looks something like this:


If you think it's a structure style, then you're wrong. It's actually a label style that uses several custom expressions. I use a block that is a rectangle on a no plot layer for the structure in profile view. You can leave the no plot structure visible, or you can turn off the display of the structure in profile view once you've added your labels.

This label will move with the structure, adjust to the size of the structure, and adjust to changes in the surface referenced in the structure. Adjusting the custom expressions, you can control how far all four sides of the rectangle are from the center of the structure based on the size of the structure.

Now if only we could assign a default label style to each structure in profile view I could finish my P&P sheets even quicker. For now, I'm just happy that I don't have to place a dynamic block at each structure then remember to go back and move it as my structure moves to an updated location.

Tuesday, March 2, 2010

Why Do You Have To Be Different?

You may think I've dropped off the face of the planet, but I haven't. I'm happy to say that I've embarked on a new career and hopefully that means you, my blog readers, will be learning some new and helpful information in the process. I'll have to discuss my journey from Point A to Point B in another post because right now I have something to show you.

Monday, March 1, 2010, was my first day to officially work as a "Civil 3D Trainer" even though I'm been doing that type of work for years now. As one of my first troubleshooting activities, I was presented with a "problem tree" that wouldn't size correctly. Sounded like a interesting issue to me, so I met with the technician to see the problem firsthand.

The drawing consisted of an existing survey that included Civil 3D points. The marker symbol was not sizing correctly when compared to its peers. In this case, Tree #4987 was supposed to be a size "12", but it sure didn't look like the nearby size "12" Tree #5072.

"How did those tree symbols get placed in the drawing?" was my first question. I was told that the tree symbols were a part of the point style. Since all the other trees in the drawing looked correct given the tree diameter size, the problem must be something wrong with that individual point.

So what was wrong with Tree #4987? It was time to take a closer look at these two points by viewing them in the Point Editor Panorama. [You can access this view by selecting the two cogo points and then left clicking on the Edit/List Points in the Modify panel of the COGO Points Contextual menu.]


Here's the Panorama view (some columns were hidden for this image).:

As I reviewed the two points in the list (you may have to use the slider bar along the bottom of the Panorama View to see additional columns), I noticed that the X-Y Scale for the "good tree" point (#5072) was set to the tree diameter size of "12", but the X-Y Scale for the "problem tree" point (#4987) was blank. I suggested that the technician reset the X-Y Scale of tree point #4987 to 12 and the tree symbol for the "problem tree" was immediately updated and now matched the symbol size for Tree #5072.

Problem solved!

Despite how easy this solution may seem now, if you didn't setup your template or know the software well enough to know where to look for this solution, you can get real frustrated. Don't let yourself get too stressed about situations like this, just learn where to go for answers.

Answers can be found in places such as the Civil 3D help files, training manuals, your in-house Civil 3D Guru, discussion forums, Civil 3D Blogs, your Autodesk reseller (if you're on subscription), and you might even have to submit a request to Autodesk directly. If your area has a local Civil 3D User Group meeting, get contact info from the "Civil 3D Gurus" that you meet there. Sometimes it's knowing how to phrase the question or using the correct terminology.

There are so many resources available to us that we sometimes overlook. Be diligent and keep working at it. Civil 3D can work like a well oiled machine if you work with it, not against it.

Good luck with your next Civil 3D problem and use the resources you have available. Most of the time the answer is out there, somewhere, just waiting to be found.

Friday, April 25, 2008

*Warning* Multiply owned object

Since I'm already having to use this in Civil 3D 2009, I'm going to post it here so it's easier for me and others to find in the future.

Isn't it frustrating when you get this type of warning message?


Great. Now what do I do? Is the drawing corrupt? Do I have to start from scratch?

Some discussion forum posts suggest that wblocking the drawing can help. Yes, it does get rid of the warning messages, but you could lose all your styles, object layer settings, defaults, etc. That's not acceptable.

Well, according to Scott's Superman post, there is a command you can type to get rid of the problem object (Replace C5C with the handle shown in your command line):

(entdel (handent "C5C"))

Since it is possible to lose a style or two by running this command, I'd like to know what I'm deleting. So after a bit more research, I found a link to Shaan Hurley's post about DbView for AutoCAD 2007. I followed the instructions and ran the program. It works with Civil 3D 2009. I only wish someone could a "delete" command button for the selected object.

Here's a few screen captures of the DbView program in action:


At this point, I would love to give you some great and wonderful insight as to what you're seeing in that last image. Unfortunately, for now all I can do is look at it and see what type of object will be deleted.

As far as deleting the object goes there are several options for running the command from Scott's post.

  1. You could edit the handle number in a text document, then paste it into the command line.
  2. You could also create a script file on your desktop. Then you would just edit the handle in the script file, save and close, then drag and drop the script file into AutoCAD. You'll need to either put a space after the final )) or make sure and add a return after the final )) in the script file or you'll have to hit enter after running the script file.
  3. Running this command through a lisp routine is another option.
It seems to me that every time I've seen this warning message, it's always been when I have been dragging styles between drawings. In Civil 3D, it definitely happens when you drag child styles into a drawing that already contains the parent style. This happens even if the parent styles were just created by dragging them from the same drawing. Hopefully it can be fixed with C3D 2009 SP1.

Thursday, April 10, 2008

PVLS PART 4: Offsetting a Profile View Label

This is Part 4 of a series on Profile View Label Styles (PVLS). This post may not make a whole lot of sense if you haven't seen the previous posts in this series. Please take a moment to read them before continuing to read this one. Here's a link to each:

PVLS PART 1: Creating Profiles for Labeling Crossing or Connecting Pipe Flowline Elevations

PVLS PART 2: Creating the Style for the Connecting Pipe Flowline Elevation Label

PVLS PART 3: Labeling the Crossing or Connecting Pipe Flowline Elevations

To use the Offset Style created in this series, you'll need to create the label style first. (Instructions for creating an offset label style can be found Part 2 of this series.

After the style has been created, right click on the style and select New... in the Settings tab of the Toolspace. For Profile Views, this will create a "Child" of the original style. It will have all the same properties and components of the original style at the time that it is created except those that you change.

On the Information tab, rename the text inside the brackets [child] to [RT-0.3]. That means that we will be creating a style that moves the text right 0.3 inches. Go ahead and left click on Apply then select the Layout tab.

Remember how we deleted the original text so that the first component was "Line for Text". This is where it comes into play.

Go to the Line section and change the Start Point X Offset to 0.3, then Apply and OK. Now place the style in the drawing or change one of the existing labels to use this style instead. Here's a screen capture of the original parent style and the new offset RT child style.


There are other ways to change the style as well. Try changing these values and see how they affect the style:
  • The length of the "Line at Insertion Point"
  • The length of the "Line for Text"
  • The Start Point Y Offset of the "Line for Text"
You should never change the values of the "Offset Connection Line", because they will always follow the start/end of the other lines in the style.

Well, that's it for my series on Profile View Label Styles. I hope you found it useful. Feel free to post a comment if you have questions or if you just want to request a topic for a future post.

Technorati Tags:

PVLS PART 3: Labeling the Crossing or Connecting Pipe Flowline Elevations

This is Part 3 of a series on Profile View Label Styles (PVLS). You should also read Part 1 and Part 2 of this series for additional information.

To label a crossing and/or connecting pipe flowline elevation, you'll need the style created in Part 2 of this series and profiles for both the main line and the crossing/connecting pipes as described in Part 1 of this series.

After you have the style and profiles created in your drawing, the rest is really simple.
  1. Zoom into the connecting pipe that you want to label.
  2. From the Civil 3d Profile menu, select "Add Profile View Labels", then "Add Profile View Labels...".
  3. In the Add Labels dialog box, select the style that you created from Part 2 of this series (mine was called Connecting Pipe Label).
  4. Choose a Marker style if you want one. I don't generally use one for this style.
  5. Left click on the Add command button.
  6. You will be prompted to select a profile view. Select the profile view by left clicking on one of the grid lines, not the actual profile.
  7. When asked to specify a station, select the endpoint at the flowline of the crossing pipe shown in the profile view.
  8. When asked to specify an elevation, you can either select the same point or specify an elevation for the insertion point of the label.
  9. Repeat this process for other connecting pipe labels that are visible in this profile view.
  10. If you need to add labels in other profile views, you'll need to left click on the Add command button again to select a different profile view.
So now the label is placed, but there aren't any elevations shown. Here's the secret:
  1. Select all the connecting pipe labels in one profile view and then look at the properties listed on the labels. There is a Civil 3D section that contains a listing for Profile1 Object and Profile2 Object. They will be set to by default.
  2. Left click on the for Profile1 Object and set that to the profile you created for the flowline of the main pipe.
  3. Left click on the for Profile2 Object and set that to the profile you created for the crossing and/or connecting pipes and pipe size changes.
Now you have the flowline elevations and all you have to do is editlabeltext on the style to change the name of the utility line and modify the pipe sizes. As I said in my first post, I'm sure you can take this style further to get the pipe sizes in it. Also, you would need to make a copy of the style and modify the text for grade breaks, and crossing pipes.

Well, that's it for Part 3. In Part 4, I will describe how to use the offset capability that we put in place when we created the Profile View Station Elevation Label Style in Part 2 of this series.

Technorati Tags:

PVLS PART 2: Creating the Style for the Connecting Pipe Flowline Elevation Label

This is Part 2 of a series on Profile View Label Styles (PVLS). You can view Part 1 of the series here.

Here's the step by step guide to creating the Station Elevation Profile View Label Style. The way this style is created will enable you to easily establish offsets in child styles as needed. That will be explained in a Part 4 of this series.
  1. If toolspace is not visible, type showts at the command line and press enter.
  2. Select the Settings tab.
  3. Double click "Profile View" in the list under your current drawing name.
  4. Double click "Label Styles".
  5. Right click "Station Elevation" and select "New...".
  6. On the Information tab, type a name for your style. I'll use Connecting Pipe Label for this example.
  7. On the General tab, set the layer as required. I'll use PROF-VIEW-TX for this example.
  8. On the Layout tab, delete the default "Station & ELevation" component (yes, the "L" is really capitalized) that is created by clicking on the near the top middle of the Label Style Composer dialog box. I do this because I want a different component to be the first one that appears when the Layout tab is selected in the future.
  9. Select Line from the Create Component dropdown list.
  10. Under the General section:
    1. Change the Name property to Line for Text,
    2. Set the Start point anchor point to Middle Center.
  11. Under the Line section:
    1. Change the Length to 2.0000",
    2. Set the Angle to 270° 00' 00",
    3. Set the Start Point Y Offset to -0.5000". This moves the beginning of the line down 0.5 inches from the point you select for placing the label.
  12. At this point, you're probably looking at the preview side of the Label Style Composer dialog box to see how things are looking. Unfortunately, the default preview state for a Profile View Station Elevation Label is set to Depth Label Style. So click the drop down arrow near the upper right corner of the Label Style Composer dialog box and select "Station Elevation Label Style" to watch the style update as you apply the changes.
  13. At this point, go ahead and select Apply so that everything up to this point will be saved.
  14. Create another line component (same as step 9).
  15. Under the General section:
    1. Change the Name property to Line at Insertion Point,
    2. Set the Start point anchor point to Middle Center.
  16. Under the Line section:
    1. Change the Length to 0.2500",
    2. Set the Angle to 270° 00' 00".
  17. Now create one more line component (same as step 9). This may seem unusual, but it will make sense at the end of the post.
  18. Under the General section:
    1. Change the Name property to Offset Connection Line,
    2. Set the Start point anchor component to Line at Insertion Point,
    3. Set the Start point anchor point to End,
    4. Set the Use End Point Anchor to True,
    5. Set the End Point Anchor Component to Line for Text,
    6. Verify that the End Point Anchor Point is set to Start.
  19. Select Apply again to save the changes up to this point. The preview tab will show that the label currently appears as if there is just one solid line.
  20. Create a text component from the create component list.
  21. Under the General section:
    1. Change the Name property to Station and Flowline Text,
    2. Set the Start point anchor point to Line for Text,
    3. Set the Anchor Point to End.
  22. Under the Text section:
    1. Edit the Contents as follows:
      1. On the format tab, set the Justification to Left,
      2. Insert text appropriate for the style you are creating. For my example, I used this text:
        STA <[Station Value(Uft|FS|P2|RN|AP|Sn|TP|B2|EN|W0|OF)]> SSL-XX=
        STA 1+00 SSL-XX
        FL (XX")=<[Profile1 Elevation(Uft|P2|RN|AP|Sn|OF)]>
        FL (XX")=<[Profile2 Elevation(Uft|P2|RN|AP|Sn|OF)]>
        I also force the XX values to a different color so that I know that these values have to be manually edited and updated as required. It ends up looking something like this:
    2. Set the Attachment point to Bottom Right (Don't ask me why. I think it should be set to Top Left, but once the text is perpendicular to the view, it seems that you have to set it to the opposite of what you think it should be.)
  23. Apply, OK, and your style is complete.
Well, that's it for Part 2. In Part 3, I will describe how to place the Profile View Station Elevation Label Style that you just created.

Technorati Tags:

PVLS PART 1: Creating Profiles for Labeling Crossing or Connecting Pipe Flowline Elevations

This is Part 1 of a series on Profile View Label Styles (PVLS). I will discuss how to label the flowlines of connecting pipes in a profile view. Armed with this information, you should be able to create your own style that shows flowlines of pipes at crossings and at changes in pipe sizes.

Well this is one label style with which I've been wrestling for some time. Then while creating an offset label style the other day, it just hit me how easy it would be to get the two flowline elevations into one style. Now, at this point, the pipe size in this particular style has to be edited manually, but maybe this style might give you some ideas on how to get everything you want labeled automatically.

The first thing you need to do is create a profile style with Line, Circular Curve, Symmetrical Parabola, and Asymmetrical Parabola component types visible, but on a "no-plot" layer. For my style, I've create a layer called _no-plot-profile and set the Plot property to "No".


Now create a profile by layout that follows the flowline of the main pipe in your profile view. Be sure to use the "no-plot-profile" style that you just created. This profile can also be used to label your pipe flowline elevations (such as the elevations shown in a band style).


Now create a second profile by layout that connects the flowline of all your crossing or connecting pipes. You can also tag the end of the smaller pipe at a pipe change (since a profile can't be exactly vertical). The second profile should look something like this:


Here's a zoomed in view of the three major locations where I use the "crossing pipe" profile. (Just click on the image to see an enlarged view.)


Well, that's it for Part 1. In Part 2, I will describe how to create the Profile View Station Elevation Label Style.

Technorati Tags: